14.5. Descriptive Statistics Tool
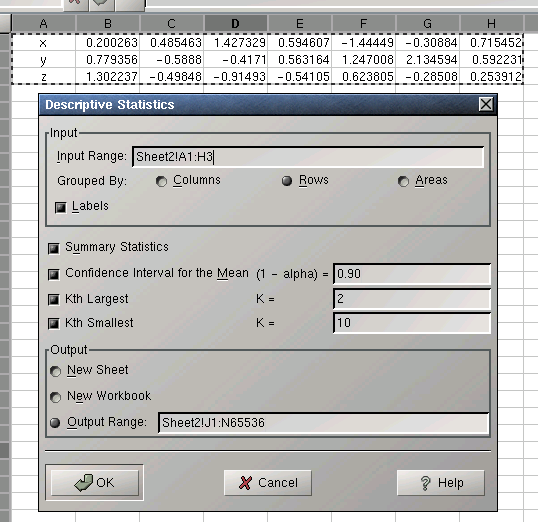
The descriptive statistics tool calculates various statistics for the given variables and a confidence interval for the population mean. The variables are specified via the "Input Range:" entry. The given range or list of ranges can be grouped into variables by columns, rows, or areas.
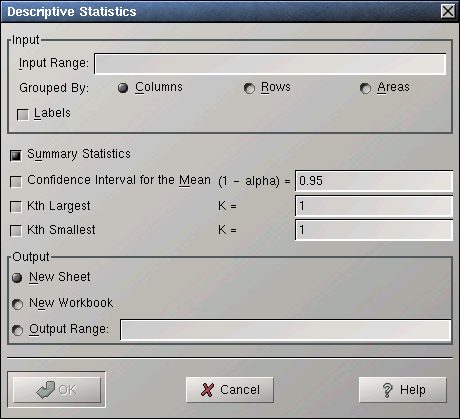
This tool can produce four different kinds of statistical data.
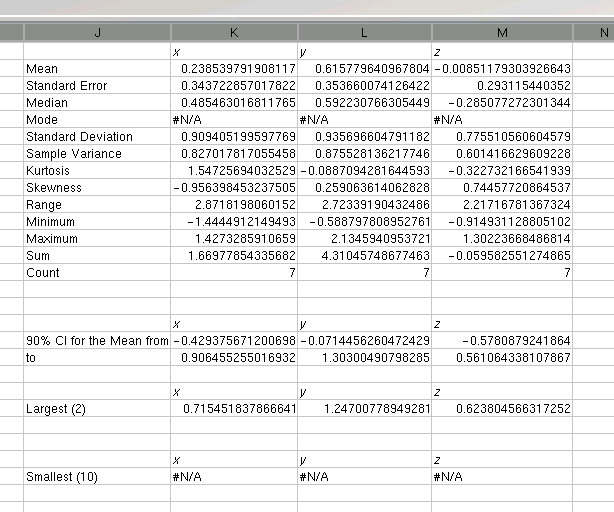
If the "Summary Statistics" option is selected, this tool calculates the mean, standard error, median, mode, standard deviation, sample variance, kurtosis, skewness, range, minimum, maximum, sum, and count for each variable.
If the "Confidence Interval for the Mean" option is selected, the tool calculates confidence intervals for the population mean of each variable. Specify the confidence level in the entry box. The default confidence level is 95%.

The interval given will usually be wider than the interval obtained using the CONFIDENCE function. The CONFIDENCE function assumes that the population standard deviation is known. This tool estimates the population standard deviation using the sample standard deviation.
If the "Kth Largest:" option is selected, the tool finds the kth largest value of each of the variables. Specify k in the entry box next to the option. The default is 1.
If the "Kth Smallest:" option is selected, the tool finds the kth smallest value of each of the variables. Specify k in the entry box next to the option. The default is 1.
If the first entry for each variable contains the label, select the "Labels" option.