Monitor Applets
Battery Charge Monitor Applet
Battery Charge Monitor applet, shown in Figure 1, displays the charge status of your portable computer battery. To learn how to add this applet to a Panel, right-click on the Panel and choose Panel->Add to panel->Applet->Monitors->Battery Charge Monitor.
 | In order for Battery Charge Monitor to function correctly, your computer must have been configured to support Advanced Power Management. |

Usage
Battery Charge Monitor just sits in your panel monitoring the status of your computer battery. By left-clicking on the applet you can toggle the view between Readout View and Graph View described in the Readout View and Graph View sections respectively.
Readout View
Readout View, the default mode of view, displays the current battery status in an iconic and textual format. In this mode Battery Charge Monitor displays the following information:
- Battery Icon
The iconic representation of a battery on the left of the applet, shows how fully charged your battery is currently. The coloured area of the battery represents the ammount of charge left in your battery, with the top of the battery representing 100% charged.
The colour of the battery changes when the charge drops below the current Low Charge Threshold (see Properties — General). The default colour of the battery is green in a normal state and red when it drops below the Low Charge Threshold.
When your computer is attached to the power supply, a small lightning bolt appears on the battery representation to indicate that the battery is attached to the power supply and is in a charging state. An example of this is shown in Figure 2. You can also configure the battery to change colour when it is or isn't connected to the power supply, see Properties — Readout for further details on this feature.
- Percentage Remaining
The percentage readout on the top right of the applet represents how fully charged your computer battery is currently.
- Time Remaining
The time remaining readout on the bottom right of the applet shows how much running time the battery has left. The time is shown in hours and minutes.

Graph View
Graph View displays the percentage of charge remaining in your battery as a moving graph. The horizontal axis represents time and the vertical axis represents charge percentage with 100% charged being the top of the graph. By default the graph is green when your computer is connected to the power supply and blue when it isn't. The graph also changes colour when the charge drops below the Low Charge Threshold (see Properties — General) the default colour in this case is red.

Figure 14. Battery Charge Monitor in Graph View
Right-Click Pop-Up Menu Items
In addition to the standard menu items, the right-click pop-up menu has the following item:
Properties... — This menu item opens the Properties dialog (see Properties) which allows you to customize the appearance and behavior of this applet.
Properties
You can configure Battery Charge Monitor applet by right-clicking on the applet and choosing the Properties... menu item. This will open the Properties dialog, with four groups of configurable items arranged in the following tabbed pages: General, Readout, Graph and Battery Charge Messages.
Properties — General
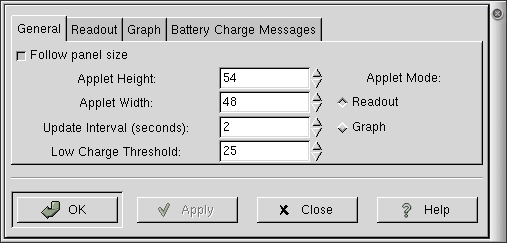
Follow Panel Size — instructs Battery Charge Monitor to resize when the panel changes size. It is checked on by default. In order for Applet Height and Applet Width settings to take affect, it must be unchecked.
Applet Height & Applet Width — these two spin buttons allow you to specify the dimensions of Battery Charge Monitor exactly in pixels. In order for these settings to take affect, Follow Panel Size must be unchecked. The default values are both set to 48.
Setting these values very small (below 28 pixels) results in the battery icon not being displayed due to lack of space.
Update Interval — specifies in seconds how often Battery Charge Monitor refreshes the battery charge information it displays. The default setting is two seconds.
Low Charge Threshold — is a percentage value of the battery charge that Battery Charge Monitor uses to optionally display a warning, it then considers the battery to have little power remaining. For example this information is used to decide when to change the colour of the battery icon in Readout View. The default value is 25.
Applet Mode — the two Readout and Graph checkboxes are another way of toggling between Readout View and Graph View.
Properties — Readout
The settings on this tab only affect Battery Charge Monitor when it is in Readout View.
All of the coloured rectangles on this tab can be left clicked on to display the GNOME colour wheel. This enables you to choose colours that you may prefer more than the defaults.
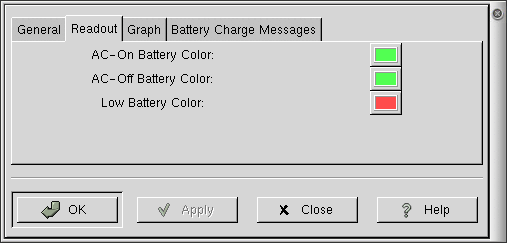
AC-On Battery Color — specifies the colour of the battery icon in Readout view when your computer is connected to the AC power supply. The default colour is green.
AC-Off Battery Color — specifies the colour of the battery icon in Readout View when your computer is not connected to the AC power supply. The default colour is green.
Low Battery Color — specifies the colour of the battery icon in Readout View when the charge percentage rate drops below the Low Charge Threshold (see Properties — General). The default colour is red.
Properties — Graph
The settings on this tab only affect Battery Charge Monitor when it is in Graph View.
All of the coloured rectangles on this tab can be left clicked on to display the GNOME colour wheel. This enables you to choose colours that you may prefer more than the defaults.
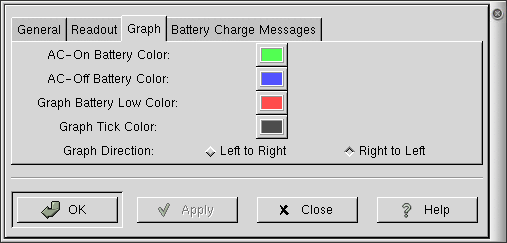
AC-On Battery Color — specifies the colour of the graph when your computer is connected to the AC power supply. The default colour is green.
AC-Off Battery Color —: specifies the colour of the graph when your computer is not connected to the AC power supply. The default colour is blue.
Graph Battery Low Color — specifies the colour of the graph when the charge percentage rate drops below the Low Charge Threshold. The default colour is red.
Graph Tick Color — specifies the colour of the graph division lines on the graph which mark the 25%, 50% and 75% charge points. The default colour is dark grey.
Graph Direction — specifies which direction the graph moves over time. The default direction is Right to Left.
Properties — Battery Charge Messages
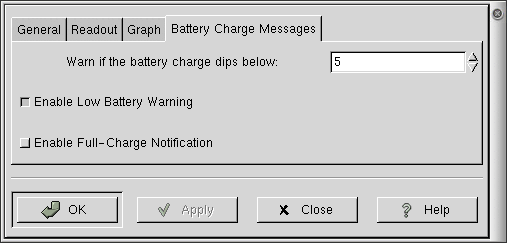
Warn in the battery charge dips below — specifies the charge percentage at which Battery Charge Monitor shows a warning dialogue box that the battery is at a low charge. This warning is only displayed if Enable Low Battery Warning is checked. The default setting is 5%.
Enable Low Battery Warning — specifies if Battery Charge Monitor should display a dialogue box warning that the battery charge has dropped below the charge percentage specified in the Warn if the battery charge dips below setting. The default value is checked.
Enable Full-Charge Notification — specifies if Battery Charge Monitor should display a dialogue box when the battery has reached its 100% charged rate. The default value is unchecked.
Known Bugs and Limitations
One oddity is if you start Battery Charge Monitor on a computer that has no Advanced Power Management support. This causes the Low Battery Warning dialogue box to be displayed which may be mis-leading.
Authors
This applet was writen by Nat Friedman <nat@nat.org>. Please send all comments, suggestions, and bug reports to the GNOME bug tracking database. (Instructions for submitting bug reports can be found on-line. If you are using GNOME 1.1 or later, you can also use Bug Report Tool (bug-buddy), available in the Utilities submenu of Main Menu, for submitting bug reports.
The documentation for this applet which you are reading now was written by James Cope <jcope@bcs.org.uk>.. Please send all comments and suggestions regarding this manual to the GNOME Documentation Project by sending an email to <docs@gnome.org>. You can also submit comments online by using the GNOME Documentation Status Table.
The CPU load applet
The cpuload_applet is a small monitor applet which sits in your panel and tells you how much CPU is being used.
Usage
You don't need to do anything to this applet. It will sit and run in your panel. Various options to alter its display are available.

cpuload_applet divides CPU use into four sorts:
- User
This measures CPU use in "userland": ie, things not talking to the kernel. The default colour for this is yellow.
- System
This measures CPU use that involves the kernel: lots of talking between memory and disc, for example. The default colour is pale grey.
- Nice
This measures CPU use which is not "nice": running at a high priority. The default colour is medium grey.
- Idle
Idle measures unused CPU capacity. The default colour is black.
Right-Click Pop-Up Menu Items
In addition to the standard menu items, the right-click pop-up menu has the following items:
- Default Properties...
This opens the multiload_applet dialogue box described below which allows you to alter the default properties of this and related monitor applets.
- Properties...
This opens the multiload_applet dialogue box described below which affects only the cpuload_applet properties.
- Run gtop...
This option will run the gtop which starts up the GNOME System Monitor. gtop gives a much more detailed look at your system and what's happening on it.
Properties
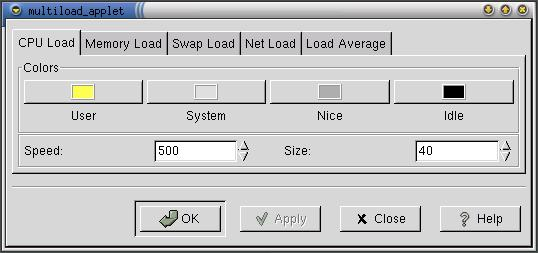
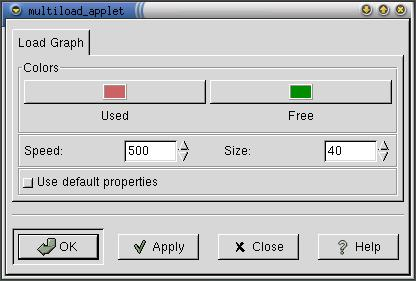
Like several of the monitor applets, cpuload_applet has two ways of setting preferences. You can make changes that affect any of this group (cpuload_applet, memload_applet, swapload_applet, netload_applet and loadavg_applet) in one large dialogue box. This is useful if you run one or more of them. These are the settings used by default. They are reached from the Default Properties... menu item.
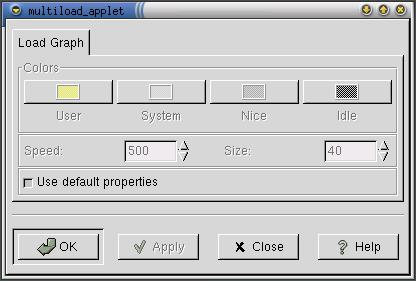
Or you can change just the properties for cpuload_applet. This is useful for when you only use cpuload_applet or want to try new combinations out. It is reached from the Properties menu item.
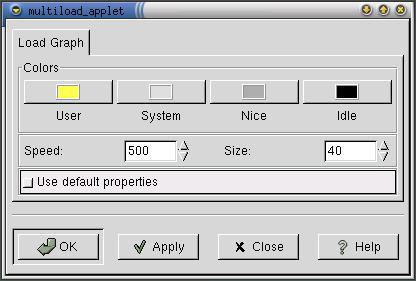
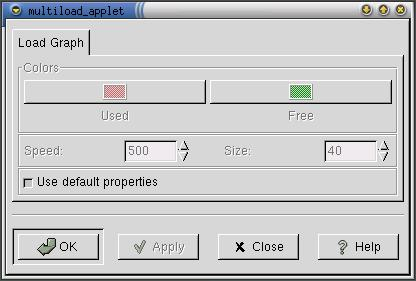
| If you use the Properties... menu item and edit the preferences for just this applet, you must uncheck the Use default properties checkbox before you can alter any settings. |
The changes you can make to the properties are three:
- Colours
You can alter the colours used for the different forms of CPU usage displayed by clicking on the colour boxes. This invokes the GNOME colour wheel.
- Speed
You can alter the speed that the graph proceeds with this. It is measured in milliseconds. The highest value is 1,000,000,000 and the lowest is 1. The default is a more sensible 500.
- Size
You can alter the size of the applet with this. It is measured in pixels. The default value is 40, and the range is from 1 pixel to whatever you like. In a vertical panel, this refers to the height. In a horizontal panel, it refers to the width.
Known Bugs and Limitations
Resizing and then altering the panel orientation can result in intermittent problems, although they now fix themselves after a short period.
Authors
This applet was writen by Martin Baulig (<martin@home-of-linux.org>). Please send all comments, suggestions, and bug reports to the GNOME bug tracking database. (Instructions for submitting bug reports can be found on-line. If you are using GNOME 1.1 or later, you can also use Bug Report Tool (bug-buddy), available in the Utilities submenu of Main Menu, for submitting bug reports.
This manual was written by Telsa Gywnne (<telsa@linuxchix.org>) and Eric Baudais (<baudais@okstate.edu>). Please send all comments and suggestions regarding this manual to the GNOME Documentation Project by sending an email to <docs@gnome.org>. You can also submit comments online by using the GNOME Documentation Status Table.
The CPU and memory usage applet
The cpumemusage_applet is a small monitor applet which sits in your panel and tells you about your machine's use of CPU, memory and swap. To add this applet to a Panel, right-click on the Panel and choose Panel->Add to panel->Applet->Monitors->CPU/MEM usage.
Usage
You don't need to do anything to this applet. It will sit and run in your panel.
The applet shows three bar charts, for CPU, memory and swap space. If your panel is horizontal, the top bar is CPU, the middle is memory, and the bottom is swap. If your panel is vertical, the left bar is CPU, the middle is memory, and the right is swap.

- CPU
Three colours are used here. Yellow is used for CPU activity which does not need the kernel. Grey is used for CPU activity by programs talking to the kernel (typically, lots of I/O such as moving things between memory and disk). Black is the background and represents unused CPU.
- Memory
Four colours are used here. Yellow is used for shared memory (memory more than one program is using). Grey is used for buffer use (memory containing data not yet written to disk). The greenish-yellow is used for other memory use. Green represents unused memory.
- Swap
Two colours are used here. Red is used for swap space in use. Green is for unused swap. Swap is a section of the hard-drive where the kernel puts parts of programs which are not currently being used so that it can retrieve them easily when it needs to.
Known Bugs and Limitations
There are no known bugs for this applet.
Authors
This applet was writen by Radek Doulik (<rodo@ucw.cz>). Please report problems with it to the GNOME bug tracking system. You can do this by following the guidelines on that site or by using bug-buddy from the command-line. For the package, put gnome-applets.
This guide was written by Telsa Gwynne (<telsa@linuxchix.org>) and Eric Baudais (<baudais@okstate.edu>) and is almost entirely based on the earlier documentation from the GNOME 1.0.53 User's Guide by David Mason (<dcm@redhat.com>) and David Wheeler. Please report problems with or suggestions for it to the GNOME Documentation Project (<docs@gnome.org>). You can also submit comments online by using the GNOME Documentation Status Table.
Disk Usage Applet
Disk Usage Applet, shown in Figure 24, provides a panel monitor for the amount of space in use and available on your disk drives. To add this applet to the panel, right-click on the panel and choose Panel->Add to panel->Applet->Monitors->Disk Usage

Usage
Disk Usage Applet provides real-time monitoring of the available space on your disk drives.
It provides three pieces of information. The colored pie graphically represents how much space is used and how much is available. MP: indicates the mount point of the disk it is currently monitoring. av: indicates the amount of space available on the selected drive, in kilobytes. Clicking on the applet changes the drive being monitored. Doing so repeatedly cycles through all available drives.
Right-clicking on the applet brings up a menu containing the following items:
File system — allows you to change the file system Disk Usage Applet monitors.
Properties— opens the Properties dialog
Update — this can be used to force the applet to update the filesystem list the applet uses.
Help — displays this document.
About… — shows basic information about Disk Usage Applet, including the applet's version and the author's name.
Customization
You can customize Disk Usage Applet by right-clicking on it and choosing Properties. This will launch the Properties… dialog, which allows you to change various settings.
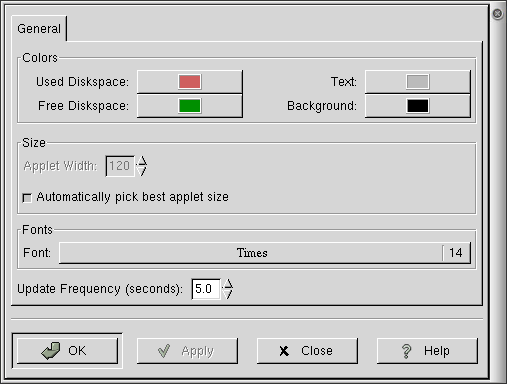
The properties are:
Colors — To change the colors displayed in the applet, click on the colored buttons next to Used Diskspace, Free Diskspace, Textcolor and Backgroundcolor. A color wheel dialog will pop up offering you color options to make changes. When finished, click on the OK button on the color options window.
Size — Applet Size and can be used to change the height (on a horizontal panel) or width (on a vertical panel) of the applet.
By checking the Automatically pick best applet size check box, you can force Disk Usage Applet to automatically choose the appropriate size for your panel.
Fonts — Clicking on the bar in this window opens a dialog box allowing you to change the font displayed in the applet.
Update Frequency — changes the amount of time, in seconds, between updates of Disk Usage Applet.
After you have made all the choices you want, click on OK to make the changes and close the Properties dialog. To cancel the changes and return to previous values, click on Cancel button.
Authors
Disk Usage Applet was written by Dave Finton <dfinton@d.umn.edu>, Bruno Widmann <bwidmann@tks.fh-sbg.ac.at> and Martin Baulig <martin@home-of-linux.org>. Please send all comments, suggestions, and bug reports to the GNOME bug tracking database. (Instructions for submitting bug reports can be found on-line. If you are using GNOME 1.1 or later, you can also use Bug Report Tool (bug-buddy), available in the Utilities submenu of Main Menu, for submitting bug reports.
This manual was written by John Fleck (<jfleck@inkstain.net>). Please send all comments and suggestions regarding this manual to the GNOME Documentation Project by sending an email to <docs@gnome.org>. You can also submit comments online by using the GNOME Documentation Status Table.
The load average applet
The loadavg_applet is a small monitor applet which sits in your panel and tells you the current load average.
The load average of a machine is a rather arbitrary number which represents how "busy" your machine is. It is calculated as an average of (very roughly) how many processes there are which are either running or are waiting for a wake-up call from the kernel. It is very useful for comparing over time with different load averages on your machine, but it is not very useful to compare it with other machines. Normally, it is represented as a fraction.

Usage
You don't need to do anything to this applet. It will sit and run in your panel. Various options to alter its display are available.
Right-Click Pop-Up Menu Items
In addition to the standard menu items, the right-click pop-up menu has the following items:
- Default Properties...
This opens the multiload_applet dialogue box described below which allows you to alter the default properties of this and related monitor applets.
- Properties...
This opens the multiload_applet dialogue box described below which affects only the loadavg_applet properties.
- Run gtop...
This option will run the gtop which starts up the GNOME System Monitor. gtop gives a much more detailed look at your system and what's happening on it.
Properties
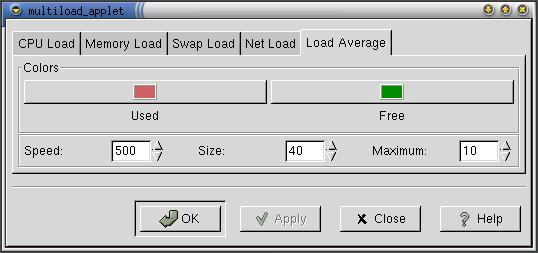
Like several of the monitor applets, loadavg_applet has two ways of setting preferences. You can make changes that affect any of this group of applets, (cpuload_applet, memload_applet, swapload_applet, netload_applet and loadavg_applet) in one large dialogue box. This is useful if you run one or more of them. These are the settings used by default. They are reached from the Default Properties... menu item.
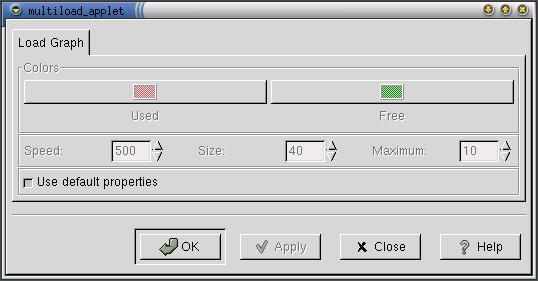
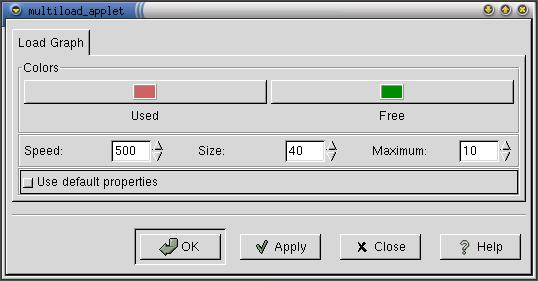
Or you can change just the properties for loadavg_applet. This is useful for when you only use loadavg_applet or want to try new combinations out. It is reached from the Properties menu item.
| If you use the Properties... menu item and edit the preferences for just this applet, you must uncheck the Use default properties checkbox before you can alter any settings. |
The changes you can make to the properties are four:
- Colours
You can alter the colours used for the applet's display clicking on the colour boxes. This invokes the GNOME colour wheel. The titles are a little misleading. "Used" is the current load average, and "free" is the background colour.
- Speed
You can alter the speed that the graph proceeds with this. It is measured in milliseconds. The default is 500.
- Size
You can alter the size of the applet with this. It is measured in pixels. The default value is 40, and the range is from 1 pixel to whatever you like. In a vertical panel, this refers to the height. In a horizontal panel, it refers to the width.
- Maximum
This is the maximum number in the Y axis (the possible maximum load average which the applet will show). The default is 10.
This option is only available from the Default Properties menu option. It does not appear on the dialogue box which is started by the Properties menu option.
Known Bugs and Limitations
Resizing and then altering the panel orientation can still cause intermittent problems, although they now fix themselves after a short period.
Authors
This applet was writen by Martin Baulig (<martin@home-of-linux.org>). Please send all comments, suggestions, and bug reports to the GNOME bug tracking database. (Instructions for submitting bug reports can be found on-line. If you are using GNOME 1.1 or later, you can also use Bug Report Tool (bug-buddy), available in the Utilities submenu of Main Menu, for submitting bug reports.
This manual was written by Telsa Gwynne (<telsa@linuxchix.org>) and Eric Baudais (<baudais@okstate.edu>). Please send all comments and suggestions regarding this manual to the GNOME Documentation Project by sending an email to <docs@gnome.org>. You can also submit comments online by using the GNOME Documentation Status Table.
The memory load applet
The memload_applet is a small monitor applet which sits in your panel and tells you how much memory is being used.
Usage
You don't need to do anything to this applet. It will sit and run in your panel. Various options to alter its display are available.

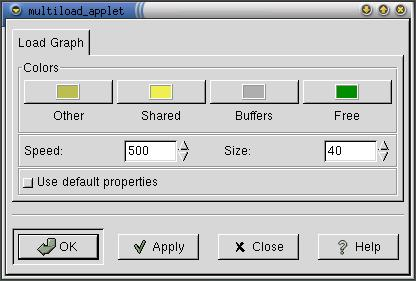
The applet shows four different uses of memory:
- Free
Free memory is memory which is not being used by any program. The default colour is green.
- Buffers
Buffers hold data which has not yet been written to the disk. They also hold data which has been recently read from the disk, keeping it around in case it is needed again. The default colour is grey.
- Shared memory
Shared memory is memory which more than one program is using. This is a very common thing to do on UNIX systems. Many GNOME programs use a lot of shared memory, which cuts down on the total memory used. The default colour is yellow.
- Other
Memory being used in other ways is shown in this category. The default colour is a greenish-yellow.
Right-Click Pop-Up Menu Items
In addition to the standard menu items, the right-click pop-up menu has the following items:
- Default Properties...
This opens the multiload_applet dialogue box described below which allows you to alter the default properties of this and related monitor applets.
- Properties...
This opens the multiload_applet dialogue box described below which affects only the memload_applet properties.
- Run gtop...
This option will run the gtop which starts up the GNOME System Monitor. gtop gives a much more detailed look at your system and what's happening on it.
Properties

Like several of the monitor applets, memload_applet has two ways of setting preferences. You can make changes that affect any of this group of applets (cpuload_applet, memload_applet, swapload_applet, netload_applet and loadavg_applet) in one large dialogue box. This is useful if you run one or more of them. These are the settings used by default. They are reached from the Default Properties... menu item.
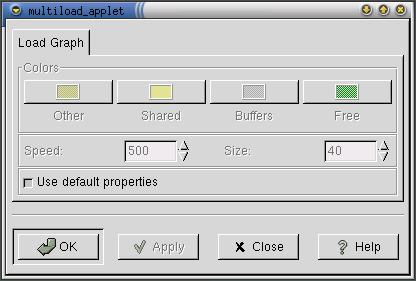
Or you can change just the properties for memload_applet. This is useful for when you only use memload_applet or want to try new combinations out. It is reached from the Properties menu item.
| If you use the Properties... menu item and edit the preferences for just this applet, you must uncheck the Use default properties checkbox before you can alter any settings. |
The changes you can make to the properties are three:
- Colours
You can alter the colours used for the different categories of memory the applet displays by clicking on the colour boxes. This invokes the GNOME colour wheel.
- Speed
You can alter the speed that the graph proceeds with this. It is measured in milliseconds. The default value is 500.
- Size
You can alter the size of the applet with this. It is measured in pixels. The default value is 40, and the range is from 1 pixel to whatever you like. In a vertical panel, this refers to the height. In a horizontal panel, it refers to the width.
Known Bugs and Limitations
Resizing and then altering the panel orientation can still cause intermittent problems, although they now fix themselves after a short period.
Authors
This applet was writen by Martin Baulig (<martin@home-of-linux.org>). Please send all comments, suggestions, and bug reports to the GNOME bug tracking database. (Instructions for submitting bug reports can be found on-line. If you are using GNOME 1.1 or later, you can also use Bug Report Tool (bug-buddy), available in the Utilities submenu of Main Menu, for submitting bug reports.
This manual was written by Telsa Gywnne (<telsa@linuxchix.org>) and Eric Baudais (<baudais@okstate.edu>). Please send all comments and suggestions regarding this manual to the GNOME Documentation Project by sending an email to <docs@gnome.org>. You can also submit comments online by using the GNOME Documentation Status Table.
The net load applet
The netload_applet is a small monitor applet which sits in your panel and tells you about the load on different network interfaces.
Usage
You don't need to do anything to this applet. It will sit and run in your panel. Various options to alter its display are available.

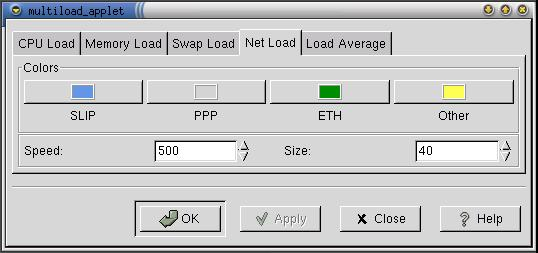
It displays details for four different types of network interfaces:
- SLIP
SLIP is the serial line IP protocol. It is not commonly used any more, being largely replaced by PPP, but it is one way of connecting a computer to other machines which was popular for modems.
- PPP
PPP is the Point to Point Protocol, for connecting one computer to another. It has largely replaced SLIP. It is effective and flexible but not as fast as ethernet. This is probably the most common way people connect from home to the internet.
- ETH
Ethernet is another method for connecting machines together. It requires an ethernet card in the computer and a piece of ethernet cable connecting it to the other machine to talk to. It's a lot faster than PPP.
- Other
Other forms of networking are available, such as ways to talk over infra-red beams (IRDA), ways to talk over amateur radio (AX25), and token-ring networks. Anything the applet finds which is not SLIP, PPP or ethernet is monitored under 'other'.
If you have two interfaces of the same type running (for example, two ethernet interfaces talking to different machines), what is displayed is the sum total of the two. The applet will not divide it into two sections.
Right-Click Pop-Up Menu Items
In addition to the standard menu items, the right-click pop-up menu has the following items:
- Default Properties...
This opens the multiload_applet dialogue box described below which allows you to alter the default properties of this and related monitor applets.
- Properties...
This opens the multiload_applet dialogue box described below which affects only the netload_applet properties.
- Run gtop...
This option will run the gtop which starts up the GNOME System Monitor. gtop gives a much more detailed look at your system and what's happening on it.
Properties
Like several of the monitor applets, netload_applet has two ways of setting preferences. You can make changes that affect all of this applet group (cpuload_applet, memload_applet, swapload_applet, netload_applet and loadavg_applet) in one large dialogue box. This is useful if you run one or more of them. These are the settings used by default. They are reached from the Default Properties... menu item.
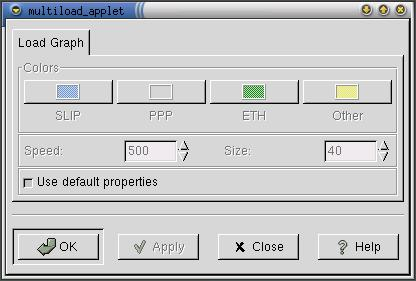
Or you can change just the properties for netload_applet. This is useful for when you only use netload_applet or want to try new combinations out. It is reached from the Properties menu item.
| If you use the Properties... menu item and edit the preferences for just this applet, you must uncheck the Use default properties checkbox before you can alter any settings. |
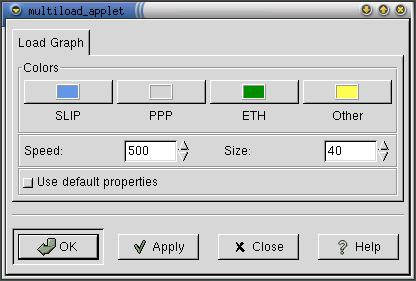
The changes you can make to the properties are three:
- Colours
You can alter the colours used for the different network interfaces by clicking on the colour boxes. This invokes the GNOME colour wheel.
- Speed
You can alter the speed that the graph proceeds with this. It is measured in milliseconds. The default is 500.
- Size
You can alter the size of the applet with this. It is measured in pixels. The default value is 40, and the range is from 1 pixel to whatever you like. In a vertical panel, this refers to the height. In a horizontal panel, it refers to the width.
Known Bugs and Limitations
Resizing and then altering the panel orientation can still cause intermittent problems, although they now fix themselves after a short period.
Authors
This applet was writen by Martin Baulig (<martin@home-of-linux.org>). Please send all comments, suggestions, and bug reports to the GNOME bug tracking database. (Instructions for submitting bug reports can be found on-line. If you are using GNOME 1.1 or later, you can also use Bug Report Tool (bug-buddy), available in the Utilities submenu of Main Menu, for submitting bug reports.
This manual was written by Telsa Gywnne (<telsa@linuxchix.org>) and Eric Baudais (<baudais@okstate.edu>). Please send all comments and suggestions regarding this manual to the GNOME Documentation Project by sending an email to <docs@gnome.org>. You can also submit comments online by using the GNOME Documentation Status Table.
The swap load applet
The swapload_applet is a small monitor applet which sits in your panel and tells you how much swap space is being used.
The swap space is a part of the hard drive which is not part of the filesystem. When the kernel decides a program in memory is not being used a lot but might be required soon, it takes parts of the program out of memory and puts those into the swap space, where it can easily retrieve it. Moving data between memory and swap can be slow, so if you are using a lot of your swap space, you may find the machine's reaction slows.
Usage
You don't need to do anything to this applet. It will sit and run in your panel. Various options to alter its display are available.

Right-Click Pop-Up Menu Items
In addition to the standard menu items, the right-click pop-up menu has the following items:
- Default Properties...
This opens the multiload_applet dialogue box described below which allows you to alter the default properties of this and related monitor applets.
- Properties...
This opens the multiload_applet dialogue box described below which affects only the swapload_applet properties.
- Run gtop...
This option will run the gtop which starts up the GNOME System Monitor. gtop gives a much more detailed look at your system and what's happening on it.
Properties
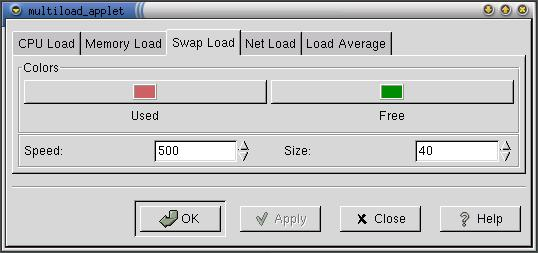
Like several of the monitor applets, swapload_applet has two ways of setting preferences. You can make changes that affect all of this group (cpuload_applet, memload_applet, swapload_applet, netload_applet and loadavg_applet) in one large dialogue box. This is useful if you run one or more of them. These are the settings used by default. They are reached from the Default Properties... menu item.
Or you can change just the properties for swapload_applet. This is useful for when you only use swapload_applet or want to try new combinations out. It is reached from the Properties menu item.
| If you use the Properties... menu item and edit the preferences for just this applet, you must uncheck the Use default properties checkbox before you can alter any settings. |
The changes you can make to the properties are three:
- Colours
You can alter the colours used for used and free swap space that are displayed by clicking on the colour boxes. This invokes the GNOME colour wheel.
- Speed
You can alter the speed that the graph proceeds with this. It is measured in milliseconds, and the default is 500.
- Size
You can alter the size of the applet with this. It is measured in pixels. The default value is 40, and the range is from 1 pixel to whatever you like. In a vertical panel, this refers to the height. In a horizontal panel, it refers to the width.
Known Bugs and Limitations
Resizing and then altering the panel orientation can still cause intermittent problems, although they now fix themselves after a short period.
Authors
This applet was writen by Martin Baulig (<martin@home-of-linux.org>). Please send all comments, suggestions, and bug reports to the GNOME bug tracking database. (Instructions for submitting bug reports can be found on-line. If you are using GNOME 1.1 or later, you can also use Bug Report Tool (bug-buddy), available in the Utilities submenu of Main Menu, for submitting bug reports.
This manual was written by Telsa Gywnne (<telsa@linuxchix.org>) and Eric Baudais (<baudais@okstate.edu>). Please send all comments and suggestions regarding this manual to the GNOME Documentation Project by sending an email to <docs@gnome.org>. You can also submit comments online by using the GNOME Documentation Status Table.